SPY rallied in the closing minutes on Monday to close at 491.27. Most of those gains were erased within the first minute of trading on Tuesday, as SPY fell to 490.52 in that opening minute. A small rally ensued until just after 10:00am, and SPY found itself just above yesterday's close, reaching a high of 491.36.
SPY spent the next hour in a narrow trading range between 490.50 and 491.00 before breaking out and rallying to 491.48 just before noon. That rally fizzled and SPY fell once again, this time to nearly 490 at 490.11. Once again SPY moved higher through the afternoon towards 491.50, hitting a high of 491.62 just before 3:30. SPY drifted lower in the last half hour, dropping to 490.72 before closing at 490.89.
Our research has shown that the optimal spread will be priced within 2 points of the close. If the close is a whole dollar amount the choices are easy, with the long leg of the spreads priced at 1 point above and 1 point below the close, and the short legs priced at 2 points above and below the close. If the the close is on a half dollar amount. we set the long legs at the nearest whole dollar strike, and the short leg one point further out. For our purposes we us quarter points as the cut-offs. Anything > 0.25 and < 0.75 is considered a half dollar. Prices 0.25 and below are rounded down, and prices above 0.75 are rounded up.
With SPY closing at 491.27 on Monday our Bull Call Spread consists of a Long Jan 30 '24 492 Call and a Short Jan 30 '24 493 Call. These were priced at approximately 0.95 and 0.58 respectively, for a cost of 0.37.
Our Bear Put Spread consists of a Long Jan 30 '24 491 Put and a Short Jan 30 '24 490 Put, priced at approximately 1.08 and 0.73 respectively, for a total cost of 0.35.
Out total price for the two spreads, therefore is 0.37 + 0.35 = 0.72.
We can see from the chart above that SPY traded between basically unchanged, and down a point. Normally we would look for a change of +/- 2.0 points for our combination spread to be profitable. In many cases treating this as two separate trades can be more profitable than looking at it as one trade.
We mainly use the 15 Minute chart to give us exit points.
From this we can see the morning dip, and the rally into the 12:00 hour. SPY was coming off overbought territory, with MACD topping out. The rally off the opening gap lower gave us our first sell signal. Notice that the morning dip then brought the 5 Period RSI near the 50 level, with the rally taking the RSI(5) above 70 and into overbought territory. It also formed a negative divergence from Monday's close, indicating a short term high. MACD was also now trending down. This gave us a second sell opportunity.
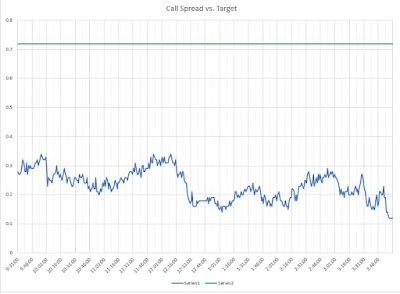
We can match this up to the Call Spread chart:
We see the call spread rose above 0.30 during the rebound off the opening gap lower, and moved above 0.30 once again during the rally into the noon hour. The Call Spread portion of our trade could have been closed out above 0.30 in either case.
Looking back to the 15 Minute chart, we see that the decline after the noon hour to 490.13 took the RSI(5) below 30, and into oversold territory. MACD was still trending down, but had also become somewhat oversold. This indicated a good spot to close out our Put Spread.
Matching that up with our put spread chart shows that we the spread was trading above 0.50 during that time frame.
So even though SPY traded within a range of barely more than 1 point, we could have closed out the bull call spread at 0.30 or above, and closed out the bear put spread at 0.50 or above, for a total of 0.80 or above, compared to our cost of 0.72, resulting in a profitable trade.
Today SPY closed at 490.89, so our spread combination looks like this:
Bull Call Spread
Buy Open Call Jan 31 '24 492 1.04 1.07
Sell Open Call Jan 31 '24 493 0.74 0.75
Bear Put Spread
Buy Open Put Jan 31 '24 490 1.47 1.51
Sell Open Put Jan 31 '24 489 1.05 1.09
Total Bid/Ask 0.67 0.79


